import math
import numpy as np
import matplotlib.pyplot as pltWhat are derivatives?
Lets dive into what are derivatives
Let’s create a random function
def f(x):
    return 3 * x**2 - 4 * x + 5
xs = np.arange(-5, 5, 0.25)
ys = f(xs)
plt.plot(xs, ys)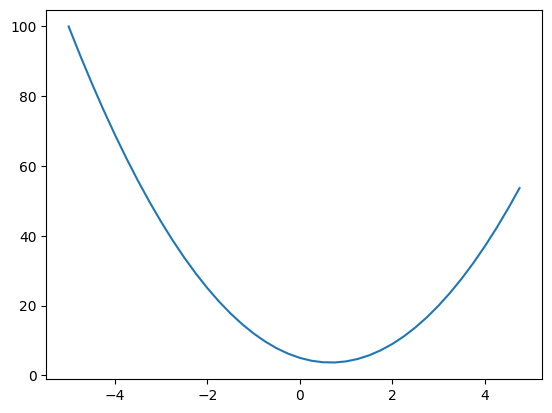
The formula for derivative is….
\[\frac{df(x)}{dx} = \lim_{h \to 0} \frac{f(x+h) - f(x)}{h}\]
Nudging the function slightly and checking what it’s effect would be on the function
h = 0.0001  # beware! don't make it too small! (why?)
x = 3.0
f(x), f(x + h)
(20.0, 20.001400030000006)We can quantify this nudge by taking their difference and dividing it by the nudge step (or “normalising” it by the step size 😉)
dfdx = (f(x + h) - f(x)) / h
dfdx14.000300000063248For a multi-variate funtion, we can nudge it with respect to any 1 variable
This wil help us look at the behaviour of the function when we change the value of any 1 variable slightly
Say \[f(x, y, z) = x^2 + y^2 + z^3\]
This can be differentiated wrt x, y or z
So we can look at \[\frac{df(x, y, z)}{dx} \ or\ \frac{df(x, y, z)}{dy} \ or\ \frac{df(x, y, z)}{dz}\]
Let’s say
h = 0.0001

# inputs
a = 2.0
b = -3.0
c = 10
d = a * b + c
print(d)4.0We want to inspect what will happen to d if we change a slightly
d1 = a * b + c
a += h
d2 = a * b + c
print("d1:", d1)
print("d2:", d2)
print("slope:", (d2 - d1) / h)
d1: 4.0
d2: 3.999699999999999
slope: -3.000000000010772Lets try with b now
d1 = a * b + c
b += h
d2 = a * b + c
print("d1:", d1)
print("d2:", d2)
print("slope:", (d2 - d1) / h)
d1: 3.999699999999999
d2: 3.99990001
slope: 2.0001000000124947Note: Slightly increasing a decreases the value of d but slightly increasing b actually increases the value of d. Here the “slope” or “gradient” or “derivative” tells us what is the magnitude of the change